


Performance monitoring
Health and safety
Nick Flaherty reports on the latest developments in ways to monitor the performance of uncrewed systems.
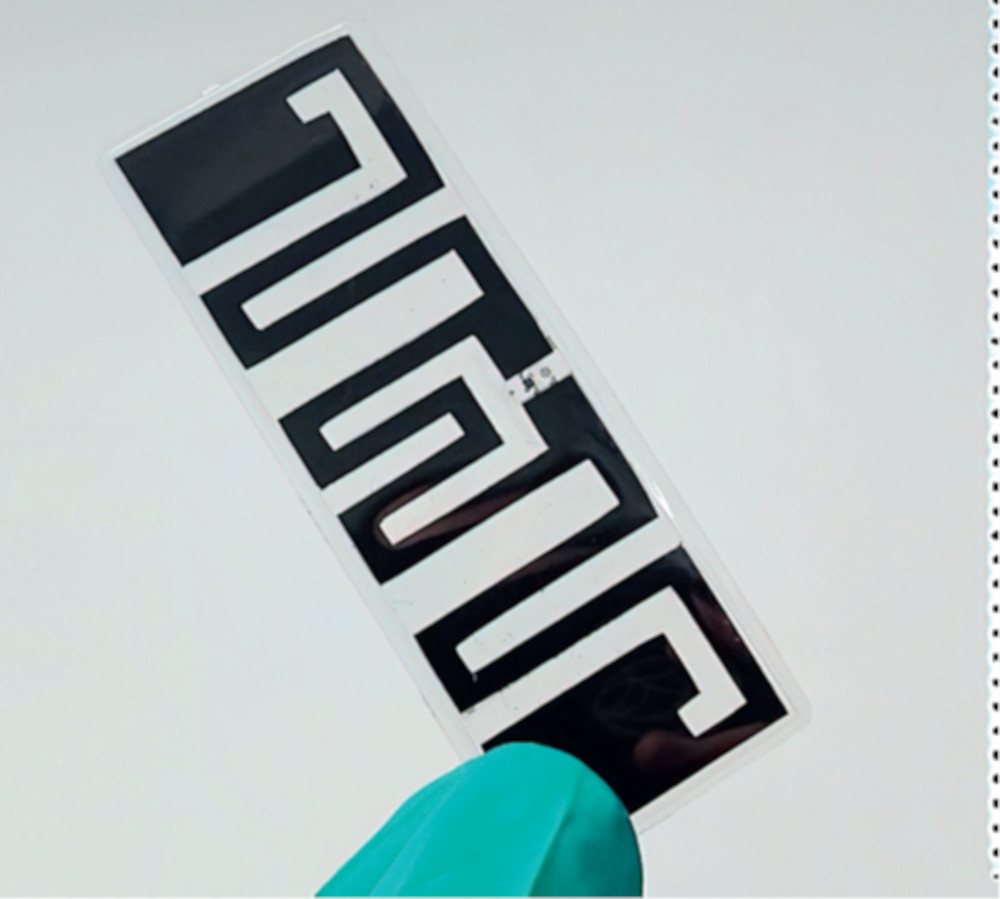
monitoring in composite materials
(Courtesy of Advanced Material Development)
Monitoring the performance of uncrewed systems is evolving. The increasing number of sensors in a platform, with more integrated electronics to provide data about system performance, is driving up the complexity of designs, and is leading to new comms protocols to transmit the data. The use of AI and machine learning(ML) is growing as well. That can help UAV operators improve the performance of their systems, and provide data for autonomous monitoring.
Also, new materials are allowing sensors to have greater physical flexibility and enabling more effective ways to connect them up. They are providing different ways of reliably monitoring the performance of systems as well. One prime example is nanocarbon graphene platelets, which in different sizes provide the ability to print sensors on or even inside composite structures, and connected to printed antennas.
With the nanocarbon platelets in paint rather than using aluminium casings, the sensors can then be shielded from EMI for more reliable sensing, saving weight in airborne systems. The platelets and the printing process can even be tuned to allow a frequency window for the wireless comms while shielding the sensors from unwanted signals to boost the signal-to-noise ratio.
Printing sensors
The platelet-based material can be used to print ultra-sensitive, non-metallic sensors such as strain gauges, gas sensors or temperature sensors. This allows them to be printed where they are required, for example in hotspots or on key surfaces such as ailerons or inside the engine.
The non-metallic nature of the platelets also means that sensors made from them are less susceptible to corrosion in harsh environments. The platelets also have a high surface area-to-volume ratio, so nearly every atom interacts with its environment.
That allows a highly sensitive sensor to be produced in a thin layer, which can provide far more detail for engineers about the operating environment and highlight problems before they become critical, allowing preventive maintenance.
Strain gauges can even be included in the layers of a composite material, for example the spar of a UAV or the suspension of a driverless vehicle. The advantage with printing is that it includes the signal lines from the sensor, connecting to an exterior antenna printed using a variant of the material. The antenna is passive, meaning it can receive a signal from an RFID reader to take a measurement from the sensor, eliminating the need for a battery or RF front end.
(Courtesy of Advanced Material Development)
The RFID reader can operate at distances of several metres, allowing the sensor to be monitored at the end of a mission to determine the condition of the component or even during a mission via an onboard RFID reader.
The painting approach also means it will work with foam-based or elastomeric structures that are also lightweight but difficult to monitor.
Monitoring composite materials
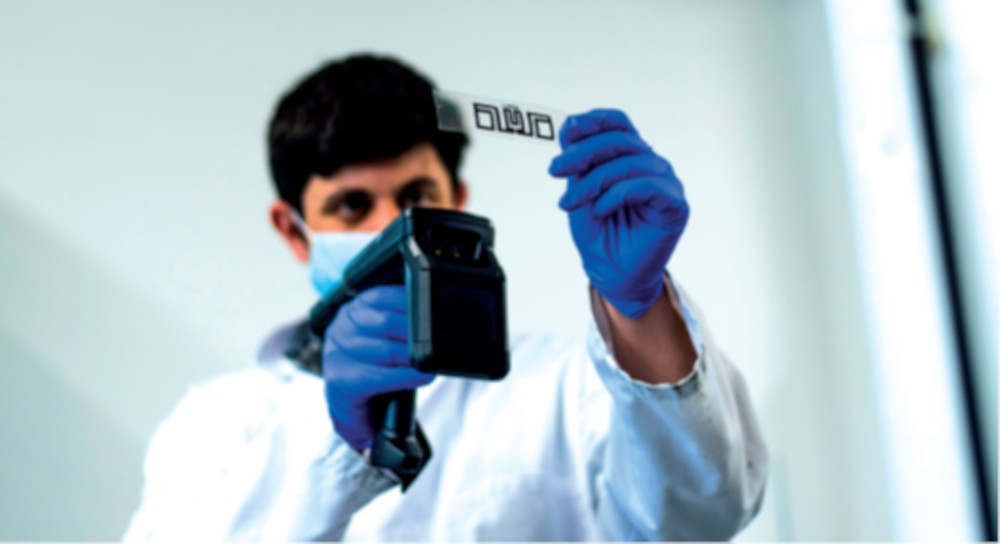
The graphene material has been used to make a wireless, remotely readable strain and temperature sensor to monitor stresses in the manufacturing and transport of composite structures.
That reduces the need for destructive testing of the quality of a composite, reducing costs and waste throughout the manufacturing process. The strain sensor in the composite material can also potentially be linked to an external antenna to provide data in operation.
EMI shielding
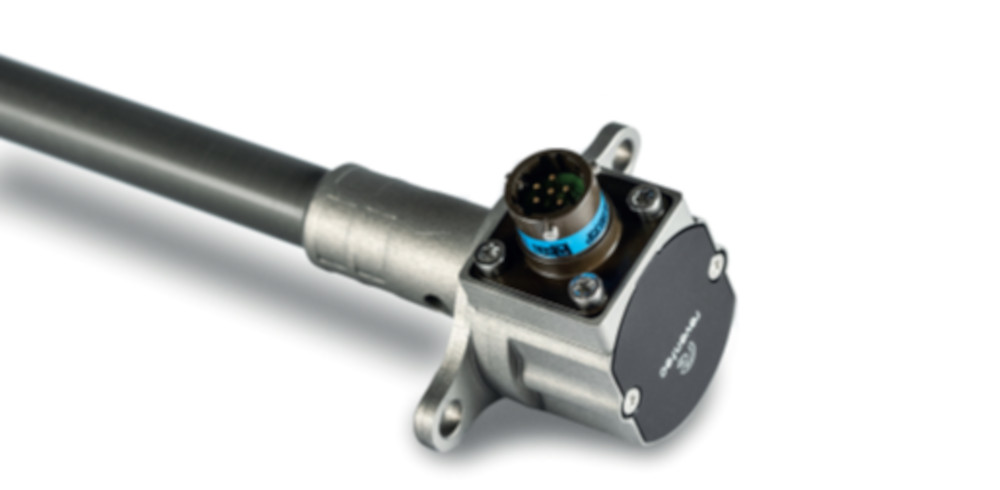
stringent EMI standards
(Courtesy of Reventec)
EMI can interfere with sensors with low output signals, such as strain gauges and temperature sensors, with an output of millivolts. This interference reduces the signal-to-noise ratio and can have a major impact on measurement performance. This is often compensated for with electronic filters and digital signal processing, but that adds weight and power consumption.
Instead, using a coating 33 microns thick reduces the interference by up to 50 dB across a frequency range from 300 MHz to tens of gigahertz. As the material weighs 2 g/cm3, the layer weighs 66 g/m2. It has a conductivity of more than 500,000 S/m, approaching that of copper- or silver-based coatings. A comparable aluminium shielding enclosure would have to be 100 microns thick, and would weigh 270 g/m2.
Frequency window
Graphene platelets also act as a meta-surface, an artificially crafted structure that derives its properties from an internal microstructure rather than its chemical composition. This meta-surface uses the geometry of the microstructure and the printing process to tune the RF properties to be active in only certain windows of the spectrum.
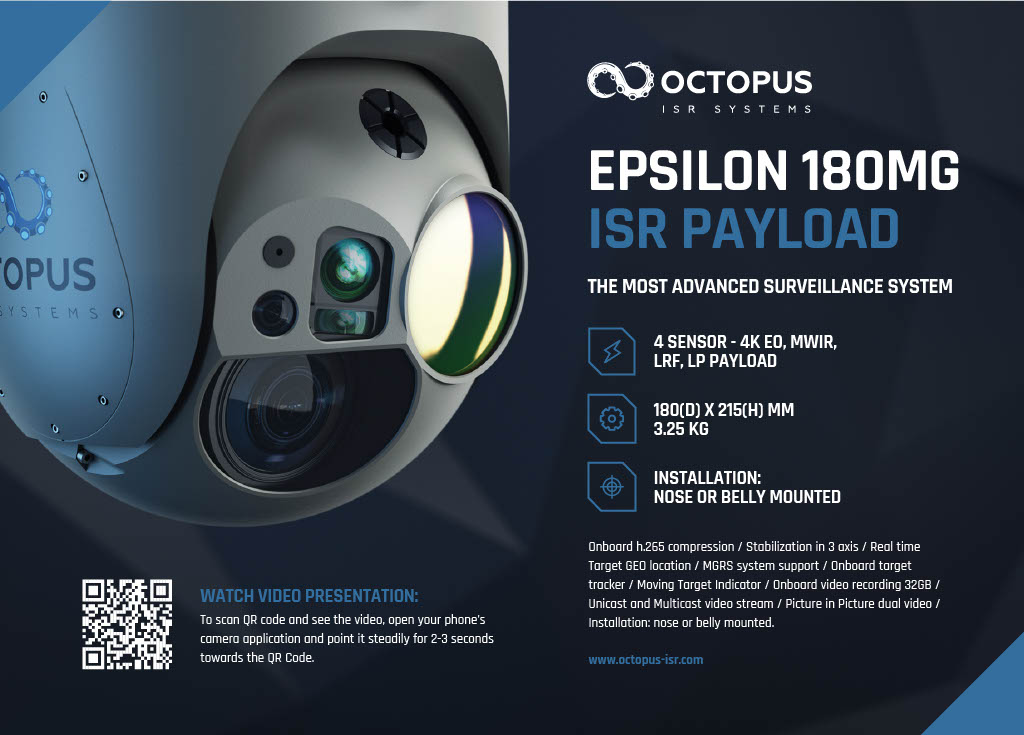
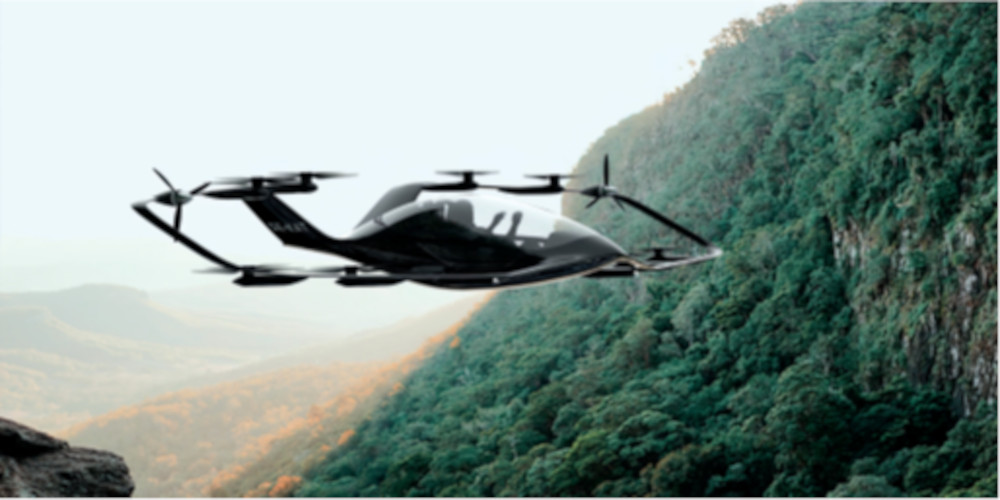
for performance monitoring in a UAV
(Courtesy of UAV Navigation)
This provides the ability to print antenna structures where all the background radiation is absorbed, but there is a filter for a 30 or 40 MHz window for example. This can be used to block harmonics from other electrical systems as well as stray 5G or 4G signals, but still provide access for the RFID signals.
The filtering can even change during operation. For instance, a system could use a coating that modifies its transmission of RF energy as a function of mechanical deformation or stress. So, if a component stretches by say 5 or 10%, the transmission in a specific window can change by 80%. This would provide an emergency signal on a different frequency to highlight a problem.
As a built-in component measuring structural health, the coating can transmit as it deforms, measuring localised stress and communicating the mechanical integrity of the part to other systems. That could provide real-time measurement of health in a tiny window unaffected by all the other RF components on the platform.
Testing performance
The graphene platelet material has demonstrated a shielding performance of about 50 dB, and shown to provide shielding at higher frequency applications for the same amount of shielding from 10to 80-plus GHz. In contrast, silver coatings shield EMI in the low gigahertz window with an attenuation of the order of 35-60 dB depending on the thickness of the spray coating, which can be hundreds of microns. The next generation of graphene coatings will potentially be able to give as much as 90 dB attenuation from a layer of around 20 microns.

The graphene material can be sprayed directly onto complicated, corrugated, non-planar structures, and works extremely well across a range of temperature windows for high-performance cars, for example. It can also be applied as a coating or a laminate with an adhesive layer on the back to put down as tape on a UAV.
Battery monitoring
The material is well-suited for monitoring the performance of battery packs.
Strain gauges can provide data on the swelling of cells with silicon anodes during charging, while temperature sensors can provide key data to control fast charging, preventing thermal runaway in lithium-ion cells. Current monitors can also provide key data on the performance of the cells, and using printed antennas to connect up all these sensors avoids the weight of a wireless battery management system.
technologies for sensors in vehicles such as UAVs
(Courtesy of Cyphal)
The next generation of materials will combine carbon graphene with silicone for even more efficient monitoring, and will have a heat conductivity of up to 25 W/m.K. These can be deployed directly against cells for heat transfer when aluminium enclosures are replaced with composite materials, as well as providing EMI shielding.
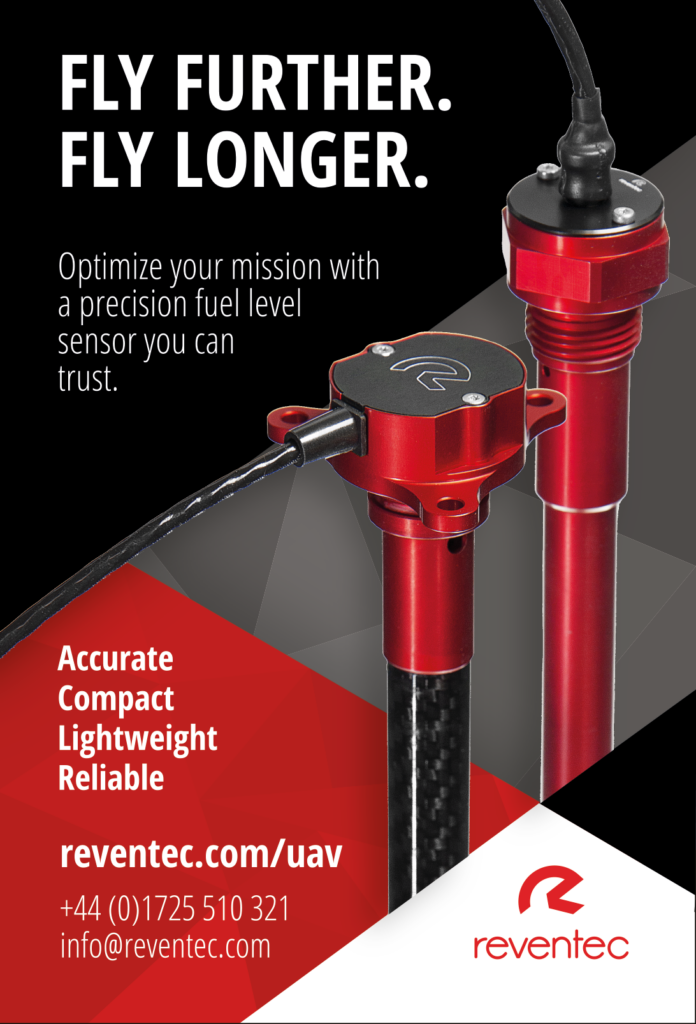
Fuel level sensors
Every gasoline-powered UAV has to measure how much fuel it has, and the more accurately that is measured the further the UAV can fly.

The latest solid-state capacitive level sensors are adding additional processing to output not only the fuel level but also various temperatures, such as the tank temperature or the fuel temperature directly from the bottom of the tank.
With more processing, a key requirement is the ability to pass stringent EMC tests. Many level sensors are tested to industrial standards, but military-spec testing to Mil-Std 461F and RTCADO160F Section 25 can be 10 to 15times more aggressive than industrial tests. These test against conducted susceptibility as well as testing for EMI that might occur through the cable and power leads. They also test the protection against radiated emissions and voltage spikes as well as electrostatic discharges, which can disable the electronics in the sensor.
These tests ensure that the level sensor with its integrated electronics will remain reliable in harsh EMI environments.
AI for performance monitoring
From a UAV operation perspective, performance monitoring is mostly about alarms or maintenance. Normally the UAV communicates through the base station, where all the alarms are colour-coded.
An operator doesn’t have time to take numeric values on the ground station’s display into account, so it is about alarms and how to make the data easily available. For example if the IMU is not operating correctly then safety action shave to be taken, such as opening the parachute to ensure that the UAV is recovered safely.
All the data from a mission – navigation drift, speed, control commands and so on– is also available at the end of a mission via a log file for analysis.
(Courtesy of Katla.aero/Cyphal)
One of the most common questions after a flight is regarding the flare attitude, pitching up the UAV to get altitude for landing. If this is performed at too high an altitude, it can cause damage; too low and it can be ineffective. The autopilot checks the altitude, the real distance from the UAV to the ground and the indicated airspeed, as well as the maximum pitch, and generates the automatic actions to correct the craft’s attitude if these are outside a pre set range.
These alarms are the standard way for the operator to check the correct operation of the UAV, as they will notice if a value falls outside the normal range. However, it is important to avoid overwhelming an operator with too many potential alarms, and this is where ML is helping.
One UAV developer has written a tool that gives access to all the parameters and the most common alarms so that operators can start adding more parameters to the screen via a configuration file.
For each flight, the tool opens a different file with all the data. This is done semi-automatically, and even during the mission the operator can access the graphics, which is useful for the engineers to check that everything is working as expected.
For a UAV to monitor itself in operation, however, the autopilot is the critical component. It takes data from sensors around the craft, from navigation and the IMU to the servo controller and the engine sensors, but the key is knowing whether that data is in the safe operating range, so it needs labelling.
This is where ML and all the collected data come in. Using techniques such as reinforcement learning can provide a framework for making decisions about the performance data during the mission.
To do that, data collected from UAV development flights needs to be labelled. With 150 to 200 variables for each flight– and data being collected every second– that is a considerable task. After each flight the log files are put on a server with information from the alarms.

Labelling this data can be time-consuming, so there are tools to automate the process, taking the data from the log files and formatting it for the ML system. This includes labelling whether a sensor is outside its normal operating range, which ties into the alarm data in the config files.
The sizes of the log files depend on the flying time – 10 to 11 hours is atypical mission, and that can generate 300 Mbytes of data. One development team has collected 80,000 hours of data since 2004, which is several gigabytes’ worth that is not yet labelled and is not necessarily structured consistently, as the sensors and parameters have changed over time.
The data then requires labelling, ideally in a way that does not need input from engineers, but this unsupervised labelling algorithm is difficult to implement accurately. A key technique is clustering, collecting groups of the same data to provide an indication of whether a data point is inside the acceptable range.
The first step has been to develop a small data set that is good enough to identify alarms. An online connection to the GCS allows an operator to upload the log file after the flight to the server, and they could then use ML to produce a report and email a summary of the flight data and any recommendations, for example highlighting vibrations in the actuator on the tail that might indicate that it needs to be replaced or scheduling it for maintenance.
That also helps the UAV developer to increase the data set for the ML algorithm, but that requires the removal of sensitive data such as the position of the UAV during a mission.
In reality, such performance monitoring systems are a combination of supervised and unsupervised learning. The operator can add manual text, while the developer suggests key words to help the ML system identify what happened.
One approach being adopted to assist the development of the ML system is to use synthetic data generated from a simulation, rather than using data from a mission.
Development engineers have generated a small data set using synthetic data from a hardware-in-the-loop (HIL) simulation tool that is set up to produce situations that are unlikely to happen. The tool combines a simulation environment that provides labelled synthetic data such as position with data from the sensors in the HIL system.
The ML network can then be trained to perform the mapping between the synthetic data and measured flight data ,for example. That is interesting, as it could allow UAV operators to obtain parameters for their platforms that at the moment would only be possible with tests in wind tunnels or CFD.
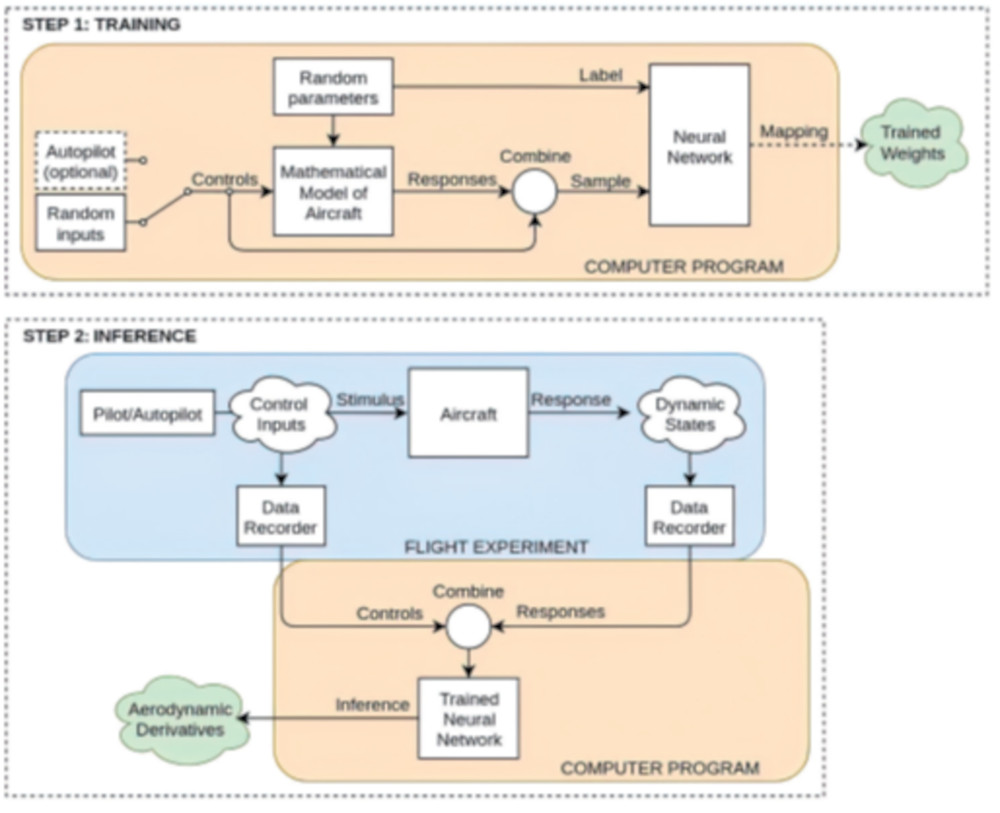
To facilitate the process of gathering data for network training, simulation techniques can be used for generating data, using automatic flight control systems coupled with mathematical models of aircraft. The procedure is performed in two phases.
During the training phase, a mathematical model (with random aerodynamic parameters) of an aircraft is propagated using random control inputs. The controls and resulting states are recorded and fed to a neural network for training, along with the corresponding derivatives.
The neural network gradually evolves the mapping between controls with their resulting states and the set of aerodynamic derivatives used. This stage is performed only once, since the resulting trained network has the ability to generalise the estimation of the aircraft’s dynamics.
During the inference phase, the trained network is fed with real recorded flight data (controls and states) to infer the aerodynamic derivatives. For validation purposes, the recorded flight data can also be simulated.
However, it is hard to demonstrate that the data is real, as some of the interactions between variables only happen in real life. Instead, the HIL system can be used as a verification tool for testing the framework once it has been developed. For example, the HIL simulator could include an engine failure, and see if the model is able to infer where the fault is happening and then how the autopilot responds.
TinyML
ML is an increasingly important element of performance monitoring inside uncrewed systems, and is leading to changes in the sensor architecture. Rather than feeding all the sensor data into an autopilot or a central ECU, monitoring can increasingly be performed locally using a specialist pre-trained ML framework running on low-power, low-cost microcontrollers.
Called TinyML, this approach is optimised for real-time event detection in devices with constrained amounts of memory. It uses ML frameworks such as TensorFlow Lite or PyTorch that are optimised for specific applications, for example audio feeds from microphones listening to a motor. The frameworks can be trained on good data as well as examples of failures in the motor.
This combination of a microphone and low-cost microcontroller, which can use an ML accelerator for low-power operation, can monitor the performance of UAV motors to detect early signs of problems. When particular audio patterns are detected, the microcontroller notifies the autopilot or ECU. This reduces the overall power consumption of the system, extending battery life and operation time by reducing the load on the more power-hungry central processor.
There are a number of tools available to install these TinyML algorithms on a microcontroller, and they are increasingly becoming automated so that engineers do not need to know the details of the underlying ML framework or the process of squeezing it into a microcontroller, a process known as quantisation.

Models are created using an analytics engine that automatically generates an optimised, device-ready model to maximise the accuracy within the specified resource constraints of the target hardware.
Resulting models are automatically translated into embedded code –with options for binary, library or full source output – delivering real-time inferencing that executes directly on the target microcontroller. This could before monitoring any kind of data stream, from audio from a motor to data from a strain gauge, fuel sensor or pressure sensor.
However, developers can also train networks with data from their own systems, and port those models to a microcontroller handling the quantisation process.
Conclusion
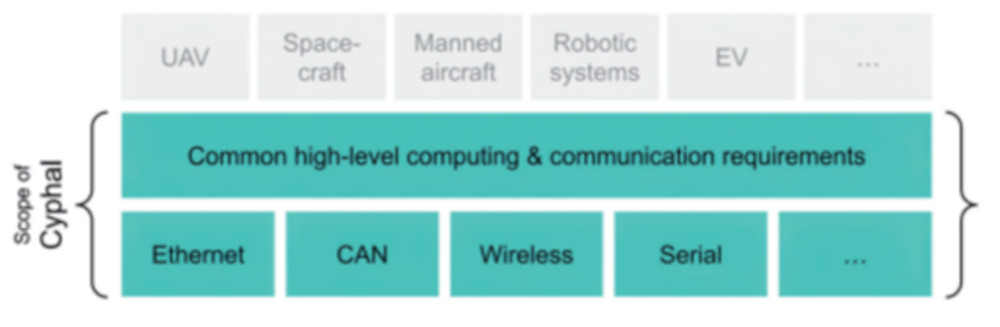
New protocols such as Cyphal are enabling sensors to be added quickly and easily to monitor the performance of uncrewed systems, while AI and TinyML are providing new ways to analyse the data and provide alarms to an operator or to the system itself. New materials such as graphene are enabling more sophisticated sensors in different places in the system, and providing new ways to connect up those sensors to monitor their performance more effectively.
Acknowledgments
The author would like to thank Peter Lynch at Advanced Materials Development, Jack Birmingham at Reventec and Miguel Angel de Frutos at UAV Navigation for their help with researching this article.
UPCOMING EVENTS


