


IQUA Robotics Soundtiles
Rory Jackson investigates how forward looking sonars are being used to capture data into accurate underwater maps through this company’s unique software
Magic of mosaics
Forward-looking sonars (FLSs) are increasingly being adopted by UUV manufacturers, ROV pilots and boat crews with pole-mounted sensors for their ability to map underwater terrain ahead of the vehicle, while simultaneously detecting and avoiding obstacles.
This capability is not something that other echo-sounder payloads such as side-scan sonars can achieve, and using a single sonar for both mapping and obstacle avoidance could save valuable space in UUVs. They also generate imagery at high refresh rates, function well in waters too cloudy for cameras, and they are being updated with SWaP-C improvements to enhance their appeal to marine uncrewed vehicle buyers working in bathymetry and similar applications.
However, the advantages of FLSs have been historically offset by some key weaknesses in how their captured data is processed into actionable maps or ‘mosaics’.
Normally, FLS mosaics are generated in one of two ways: either by taking the navigation data from the vehicle’s mission log and simply planting each captured acoustic image over the position at which it was supposedly taken, or by attempting to stitch each image together, based on common features at their borderlines, as with aerial photogrammetry.
The first approach is limited by the accuracy of the UUV’s onboard positioning system. Given the total absence of GNSS underwater and the difficulty of using acoustic localisation in many places, UUVs must often rely on inertial sensors to gauge their position at each sonar pulse, and naturally, these will have some inherent inaccuracies (particularly as drift accumulates over time). Hence, the first approach can lead to inconsistent and blurry mosaics, which cannot be relied upon by end-users.
The second method is plagued by issues unique to acoustic sensing in the underwater environment, such as moving shadows, pulses echoing or reverberating, and low signal-to-noise ratios, which makes it very challenging to stitch together sonar images into a high-quality mosaic as if they were simply normal camera photographs.
IQUA Robotics’ SoundTiles software generates sonar mosaics quite differently to both approaches, and it is enabling the creation of accurate underwater maps using FLSs.
At the heart of the software is a pairwise image registration algorithm that does not require positioning information to function and builds consistent mosaics purely on sequences of images taken from any compatible sonar file format. It is empowering the use of smaller UUVs with lighter payload complements and lower-end navigation systems.
Making SoundTiles
SoundTiles and its core algorithm originated from a PhD thesis on FLS mosaic processing, researched and published at the University of Girona in Spain. Its development has since been led by a team under Natalia Hurtós, software product manager at IQUA.
“High-quality mosaics are critical to ocean and waterway analysts across many industries for showing trustworthy maps and spatial arrangements of features across assets and areas important to them, and because by accurately aligning multiple close images across an underwater area, you can hugely improve the signal-to-noise ratio across your reconstruction of that area, compared with what you get in your initial, individual images,” Hurtós explains.
“After receiving funding to turn the algorithm and workflow into a product, the technology was licensed to IQUA, being a spinout from the same university. We then formed a team in the company for developing SoundTiles further.
“Testing and refining the algorithm took huge amounts of data. We started collecting data since my PhD days using sensors and tools at the University of Girona, and as soon as we began engineering the software at IQUA, we had different people and organisations knocking on our doors to offer sonar datasets that we could use for demonstrating and improving the system.”

These offers ramped up and continued beyond the first official release of SoundTiles in 2020, enabling ongoing optimisation and patching of the software post-release, which has been particularly important for IQUA when updating the product for compatibility with new sonar file types. Naturally, further data has come to Hurtós’ team through IQUA’s own surveys, conducted for customers using its Sparus II or Girona 500 autonomous underwater vehicles (AUVs).
“Since licensing the algorithm to IQUA, a lot of work has also gone into tailoring the user interface [UI] into something that customers could digest and get to grips with, with much owed to efforts in finding ideal tools and programming libraries to optimise that UI,” Hurtós says.
Before 2020, IQUA’s own engineers had alpha-tested the UI for the first critiques of its usability, workflows and mosaic quality, which was soon followed by beta-testing for early adopters to provide their own valuable feedback. Such suggestions are still collected today, and fed into the development roadmap that Hurtós and her team follow for future updates.
Today, SoundTiles is compatible with FLSs from Blueprint Subsea, Kongsberg Discovery, Norbit, Sound Metrics, Teledyne Reson and Tritech, thereby covering most of the systems available to UUV manufacturers, and the list will continue to grow in future.
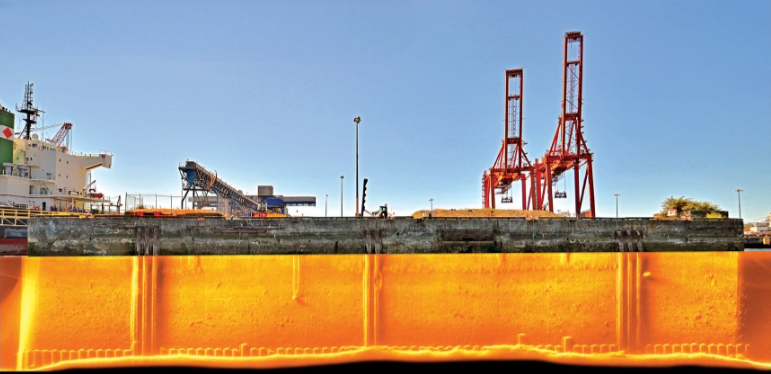
As the system functions independently of navigation data, it can generate mosaics of FLS data in any survey pattern; not only horizontal surveys, such as lengthy tunnel or river mapping or conventional back-and-forth zigzags over a broad area, but also vertical inspections of harbour walls or dams. This makes SoundTiles valuable to civil engineers and port authorities, as well as energy industries, environmental agencies, researchers, and many other groups.

User interface
The general pipeline of the user’s experience of SoundTiles is as follows: they collect their sonar files, open SoundTiles, create a project from their sonar data, and are then guided by a wizard through the steps of generating their mosaic. In most cases (particularly if the survey achieved reasonable quality data) the software outputs a sufficiently clear mosaic and the process ends there; in other cases, some additional tools are available in the software for fine-tuning the result until the user’s ideal mosaic has been created.
When starting a new project, the user selects their sonar data file and a folder for the mosaic output, and they can also pick a navigation data file; for instance, if they feel it may be helpful to their project despite not being necessary.
Next, the user is presented with the mosaic wizard’s initial screen, which summarises a plethora of information immediately extracted on the dataset (such as the sonar model used, the date of the survey, and the total number of images or frames in the file) and on the sonar (including the field of view (FoV), frames per second, resolution and pixel size).
The user can also specify a few other options in this screen, such as whether the survey was a simple rotational one (with the UUV panning horizontally on the spot), a conventional ‘constant heading’ zigzag pattern, or another. They can also choose whether positioning data will be overlaid in the mosaic, used as a primary guide for the mosaic (although, as one may guess, this is not recommended unless one intends to compare the SoundTiles mosaic with a conventionally produced one for relative quality) or disregarded.
A preview screen is also generated here, with a slider for the user to quickly flip through all the sonar images in their file individually.
Users then drag sliders to choose which frames to process into the mosaic: when a UUV starts or finishes a survey session outside of the mission-critical inspection area, eliminating those extra frames saves time and computing resources. They may also specify individual frames to be discarded, as there may be multiple overlapping and therefore redundant frames. After this, the software can generate the mosaic.
Registration and generation
The first step in mosaic generation involves the software registering or aligning the sonar images together. The time to do this varies, depending on computer processing power, and the number and size of the images, although it typically runs in the order of minutes. Hurtós notes that with a small dataset on a high-end PC, it could take just 10 seconds.
“There’s no need for any GPU or fancy processing unit, as the software is configured to run off the user’s CPU – and the more cores their CPU has, the more it can parallelise the image alignments, so the shorter the time it will take,” she adds.
During this time, the algorithm tracks the sequence of images collected along the trajectory and timing that the UUV followed, and it establishes windows within which consecutive images can be registered with each other; the user is encouraged to set window sizes of three to five images.
“Because we’re creating a 2D map, we can ‘register’ images with each other using a frequency-based technique, which finds the translation and rotation relating to each image in each window in order to bring them into the correct placement and alignment with each other, while keeping robust against noise and the different anomalies associated with acoustic images,” Hurtós explains.
She describes this technique as an algorithm designed for estimating translational shifts between images, with numerous features for overcoming the different sources of noise that can interfere with FLS image registrations, associated with the physics limitations of FLS technology, and with qualities specific to sonar and UUV dynamics.
“As each image is aligned with the next, the algorithm tracks and calculates a score of how good each alignment is. Once registration is finished, that allows the user to filter out images that haven’t aligned together above a minimum they set,” Hurtós notes. “The software will notify them of how many images will be used in the mosaic, based on their chosen threshold. There are several options they can choose for how the disconnected parts of the survey imagery can be reconnected in the finished mosaic.”

Before generating the mosaic, they may first preview the trajectory that the software believes the UUV took during its survey, based on the approximation gleaned from one pairwise image registration to the next. The trajectory is constructed of directional lines between consecutive images, and, naturally, this should closely match the navigation path originally plotted in the user’s GCS software (potentially revealing deviations in the UUV’s path caused by flow and currents of water during the survey).
“The trajectory can then be enhanced by including registrations between non-consecutive images: surveys in a back-and-forth pattern with close loops between passes will capture images with overlapping detail on consecutive passes, and we can therefore include registrations between images that exceed a minimum overlap – even up to 100% if, for instance, a UUV went down a tunnel and then back out the same way,” Hurtós says.
That enables the mosaic to be formed with the best position estimates (and IQUA has some acquisition guidelines of its own that it recommends to the surveyor to increase the chance of getting a good mosaic out of the data).
The last step is to render the mosaic. Final options include the ability to manually or automatically adjust for values such as cropping the specific region of each image to be used. A much clearer and more detailed mosaic can be constructed by omitting the ranges nearest to the sonar origin, for example, which contain featureless water-column backscatter and outer beam areas, where there is often less definition.
“You can also toggle for minimum changes in distance or rotation between images; those are very useful in either ROV or hovering AUV data acquisitions, because those types of UUV will often hover in place for a while and then maybe travel somewhere to inspect a detail of interest that they [either the operator, autopilot or onboard AI computer] have spotted,” Hurtós notes.
“This results in a non-uniform distribution of images, such as 100 in just one spot and then 100 more over the entire remainder of the survey trajectory, ultimately compromising the quality of the final mosaic. Therefore, it is advisable to filter out these images to ensure the final render is smooth and free of irregularities.”
Actionable information
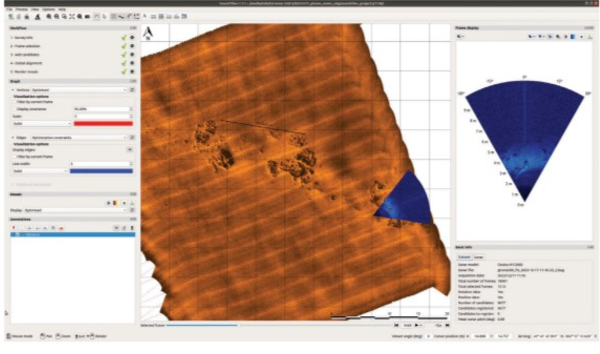
Once the mosaic is completed and the user is presented with the map of their surveyed area, they can check for quality, and, if necessary, go back through the wizard to fine-tune the mosaic. An immediate and straightforward check involves gauging the alignment of the images to the mosaic by having the software play out all the frames in chronological order across the map (by default, the full mosaic will display in an orange colour scale, while each frame shows in a blue scale to easily distinguish them).
“As the sequence of frames plays out before you, you can see if terrain features like rocks or pipes appear in the same place per frame as they do in the mosaic. That alone is a good indicator that the algorithm has resolved the imaging, positioning and registration information together well,” Hurtós says.
“You can also colour-code registrations by score, so that lines linking images that didn’t register well together will take a distinctive colour, based on your selection. Zoom in on those and you can bring up an interface comparing the pair of images with any overlap showing, from which you can see what caused the low registration score.”
To illustrate this case, Hurtós shows us two sonar images depicting (among other details) the same rock twice, albeit with a slight rotational offset between frames. Although inconsequential from an analytical point of view, she also demonstrates here that one can manually translate or rotate the images in the pairwise registration if doing so achieves a closer alignment.
At this stage, users can annotate for features in the water column, selecting points or drawing for distances, angles or squares between objects. This way, the data product can illustrate key qualities such as offsets between pipes, lengths between cracks and so on.
As well as tweaking the mosaic at the micro-scale, broader changes to image contrast, colour scale and similar factors across the mosaic can be performed to tailor the data product as the user or their own customer may wish.
Once satisfied with the image, it can be exported in any of the traditional formats, such as JPG, PNG or TIFF files, as well as GEOTIFFs if positioning information allows – the mosaic can then be imported into almost any geographic information system (GIS) software. Video files depicting the procedural, frame-by-frame generation of the mosaic can be exported for customers interested in understanding the path along which the UUV carried out the survey.

Future
As with most software products, the developers are continually on the hunt for ways to optimise and improve it. Hurtós and her team at IQUA are working to incorporate suggestions from users all the time, although as of writing, SoundTiles is considered by both the company and its customers as a mature, finished product, with no major changes being plotted or requested in its pipeline.
“The next update will bring some options for improving the illumination, and uniformity thereof, in finished mosaics, and it’s really all about just adapting the software to what users ask of us now, whether that means enhancing the UI, making the processing work faster or anything else that the industry decides makes for quality software,” Hurtós concludes.
UPCOMING EVENTS


